
Measuring the Madness
UMBC’s historic and dominant upset of UVA in the first round of the 2018 NCAA Men’s Basketball tournament instantly made a case that 2018 was the maddest March Madness ever.
Prior to that game, 1-seeds had won all 135 match-ups against 16-seeds since the tournament adopted it’s current format. Seeds are rankings within the group of teams that make the tournament. A lower seed indicates a judgement by the Selection Committee that a team is better than one with a higher seed. The UMBC game was shocking because a 1-seed should be so much better than a 16 seed that the outcome is pre-ordained.
One way to read the UMBC win is that the upset is further evidence of the tournament’s core allure — anything can happen in March! They don’t call it madness for nothing, so we fans are obligated to take two days off from work and hook up four TVs to catch every game of the opening round. Another reading of the UMBC win is that UVA should not have been a 1-seed in the first place and UMBC should have been more highly ranked. The ultimate validation for the Selection Committee is the degree to which lower seeded teams defeat higher seeded teams. Ordinal ranking of team quality is an inherently statistical process, but rather than rely on any one team quality index (like KenPom, BPI, or Sagarin rankings), we rely on the collective judgment of a group of people. Sometimes they’re just wrong!¹
To dig into this question I use two statistical methods to evaluate seed assignments in slightly different ways. First I evaluate the extent to which better seed assignments effect win probabilities. Second, I compare the number of games a team should win based on their seed assignment with the number of games they actually win. Then I analyze year to year changes in the two metrics to determine how crazy a tournament is relative to expectations.
Seeds and Win Probabilities
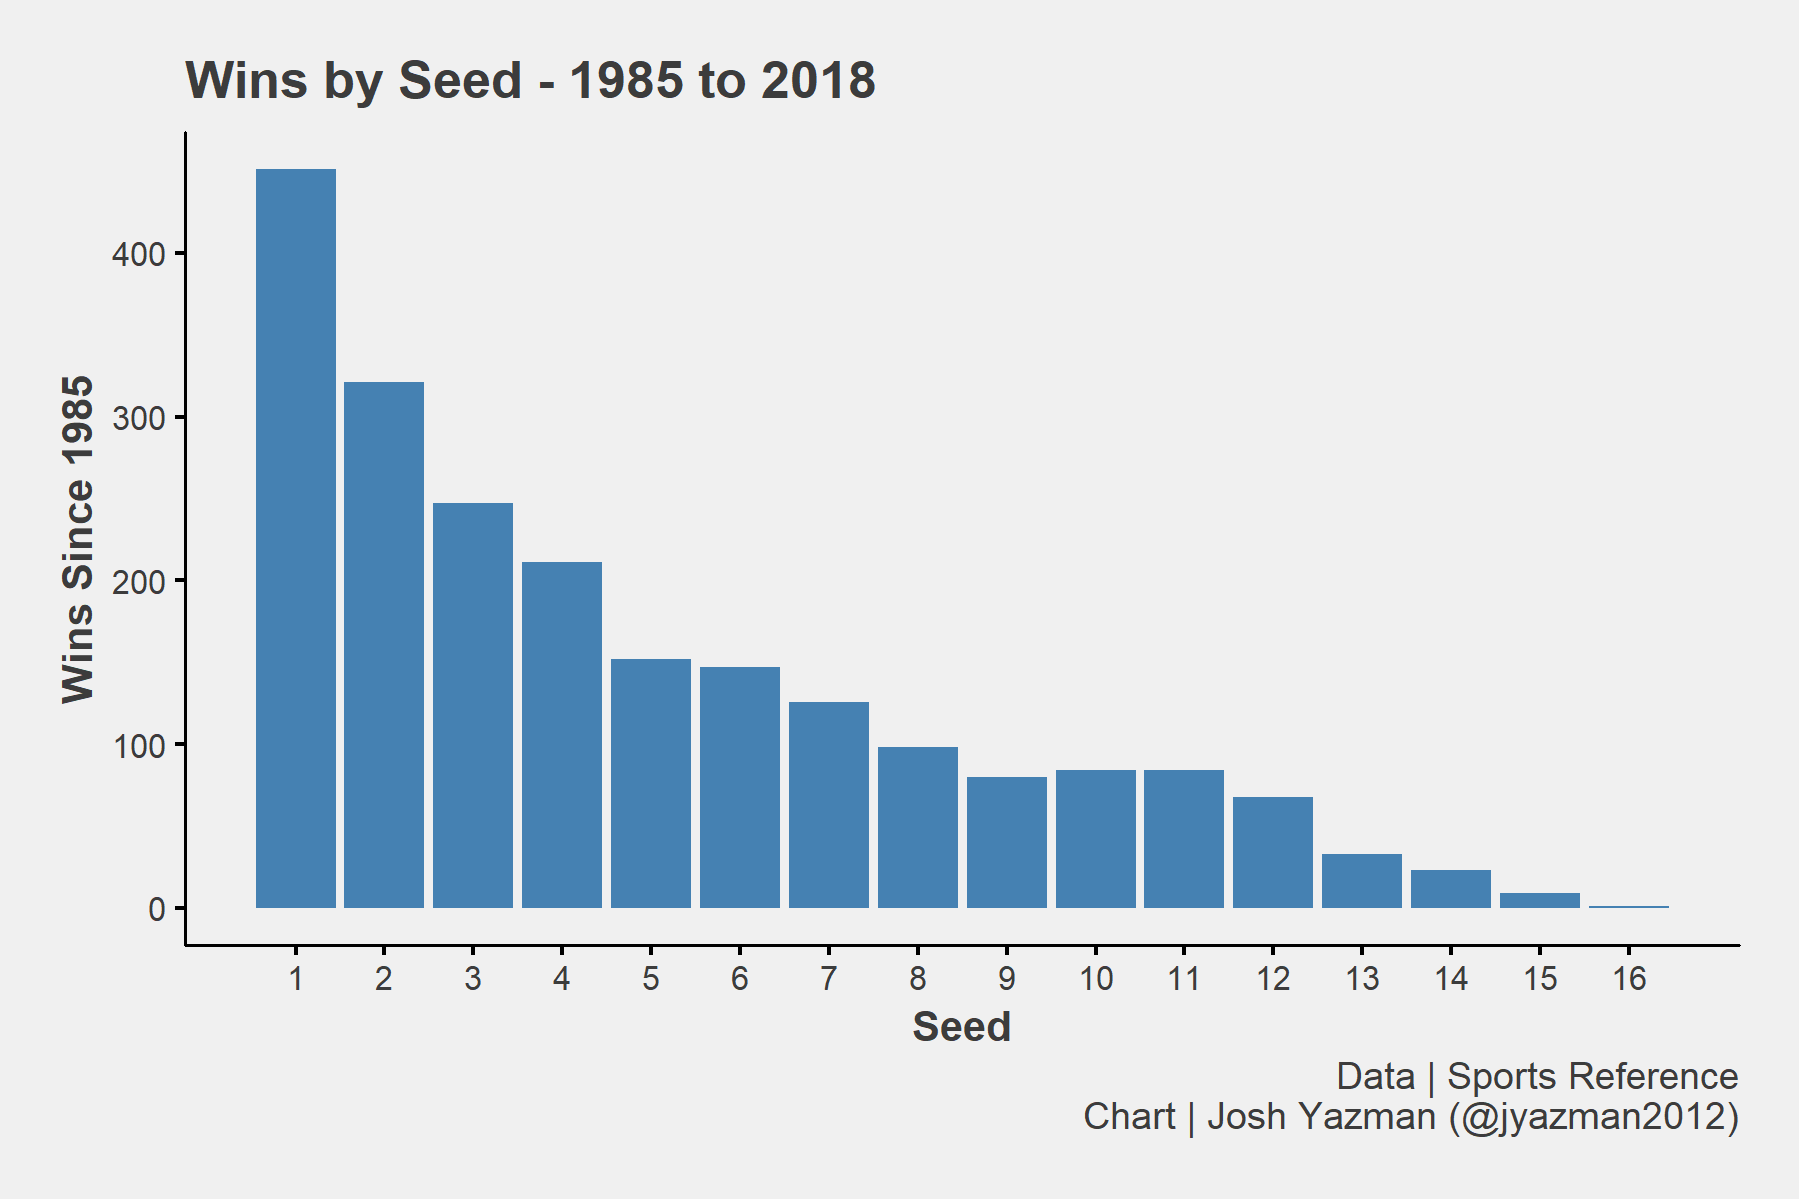
One judgement baked into a team’s ranking is that a lower seed should generally be more likely to win against a higher seeded team. 2-seeds should beat 15-seeds and they should do so more often than 7-seeds beat 10 seeds. For the most part that assumption holds up. Only one 16-seed has ever beaten a 1-seed and that happened this year — 33 years after 16-seeds became a thing! Even with closer match-ups for the most part, the lower the seed the less likely a team is to win although the trend levels out a bit with 10–11 seeds.
One way to measure the “madness” of March is to estimate the marginal effect of better seeding on win likelihood in a given match-up using logistic regression. Overall since 1985 being one seed better than your opponent makes you about 18% more likely to win a game — evidence of solid work by the committee.
Year to year regression coefficients show that madness levels fluctuate. 2007 was the least mad March as being one seed better made a team about 50% more likely to win. The final four that year was all 1–2 seeds and the lowest seeded team to make the Sweet 16 was UNLV as a 7.
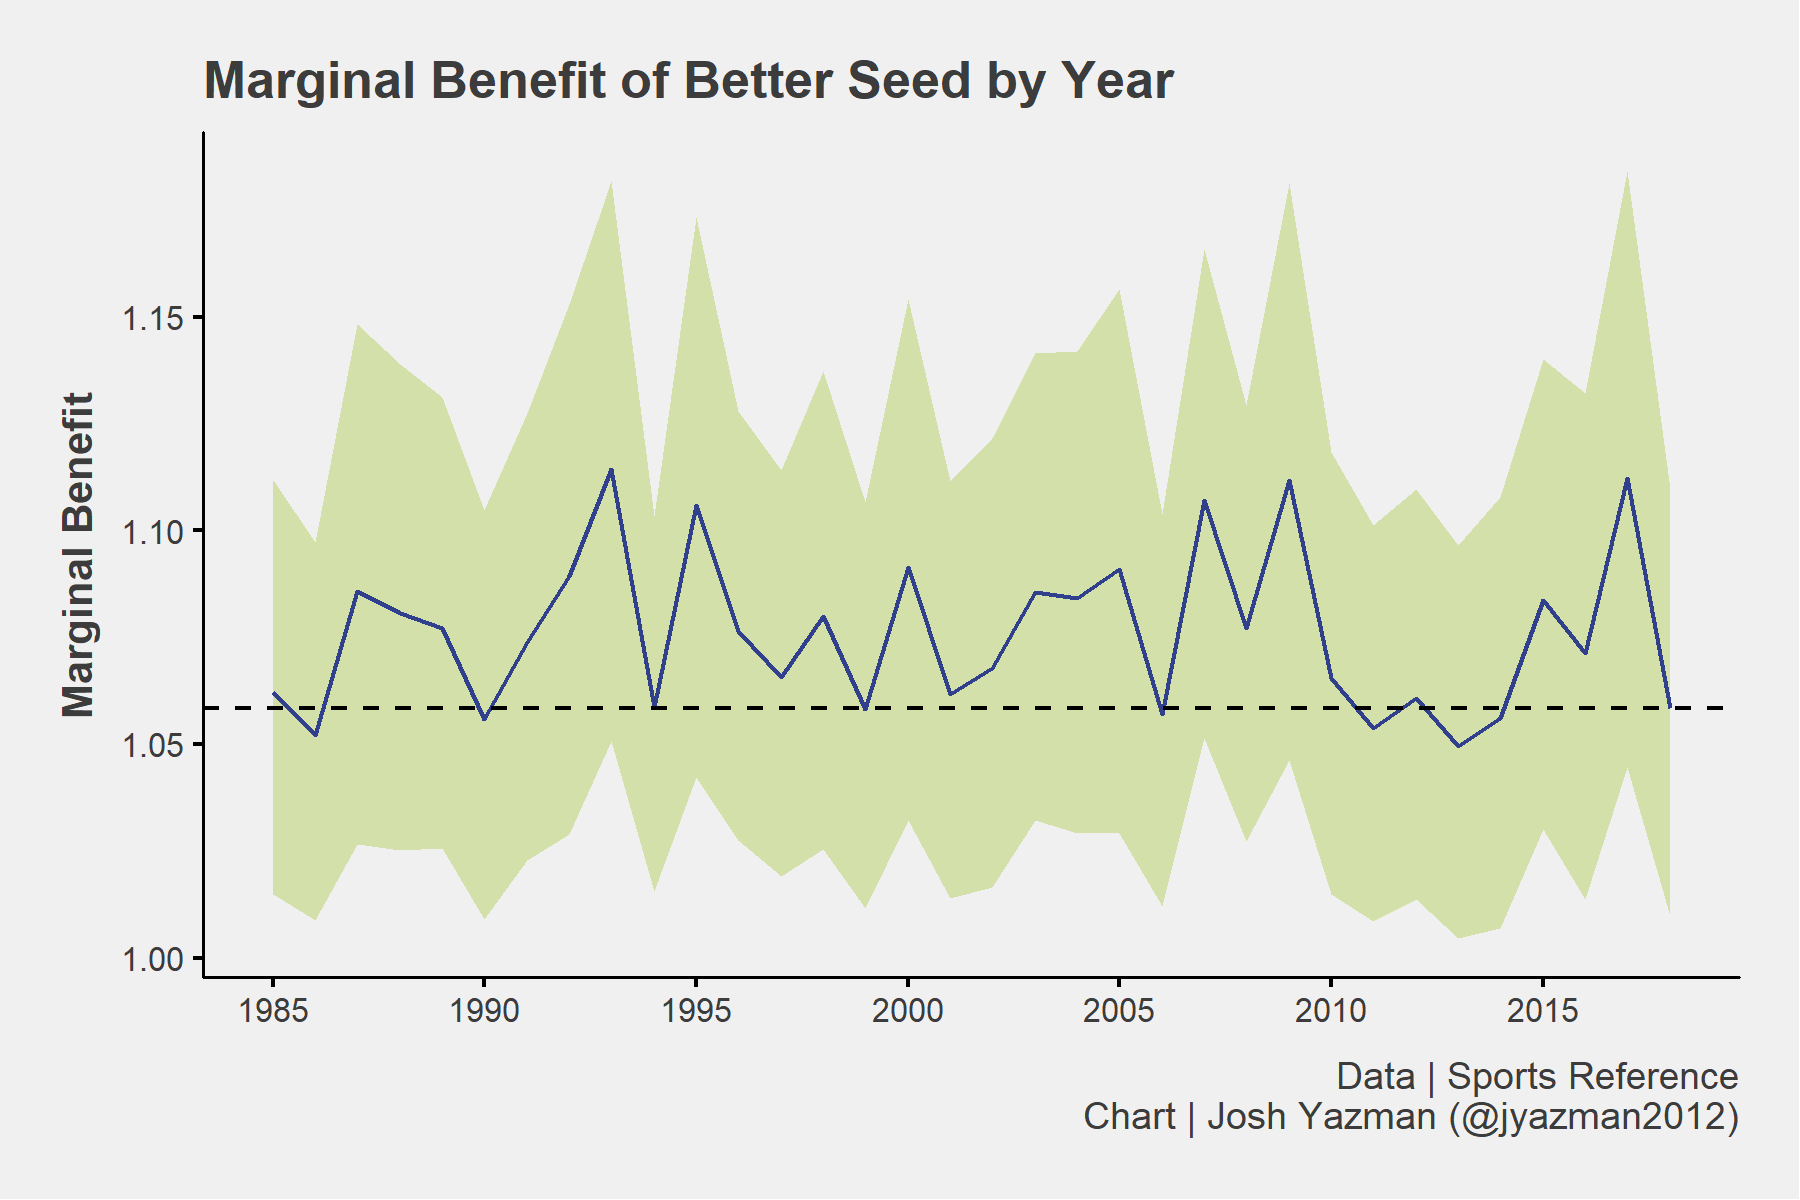
By comparison, 2018 is slightly mad but well within the margin of error as one better seed gives team a 15% better chance of winning. UVA (1) lost in the first round to UMBC (16), Loyola-Chicago (11) beat Kansas State (9) to make the Final Four, Xavier (1) got knocked out early by Florida State (9), and Marshall (13) beat Wichita State (4) in the first round. Some other picks were more predictable, though, like Kansas (1) and Villanova (1) moving past Duke (2) and Texas Tech (3) respectively to make their own Final Four trips.
Number of Games Won
Seed assignments are the selection committee’s way of saying that a lower seeded team is better than a higher seed. That means the selection committee believes that all 1 seeds — the best judged teams in each corner of the bracket — should make the Final Four and therefore win at least four games.
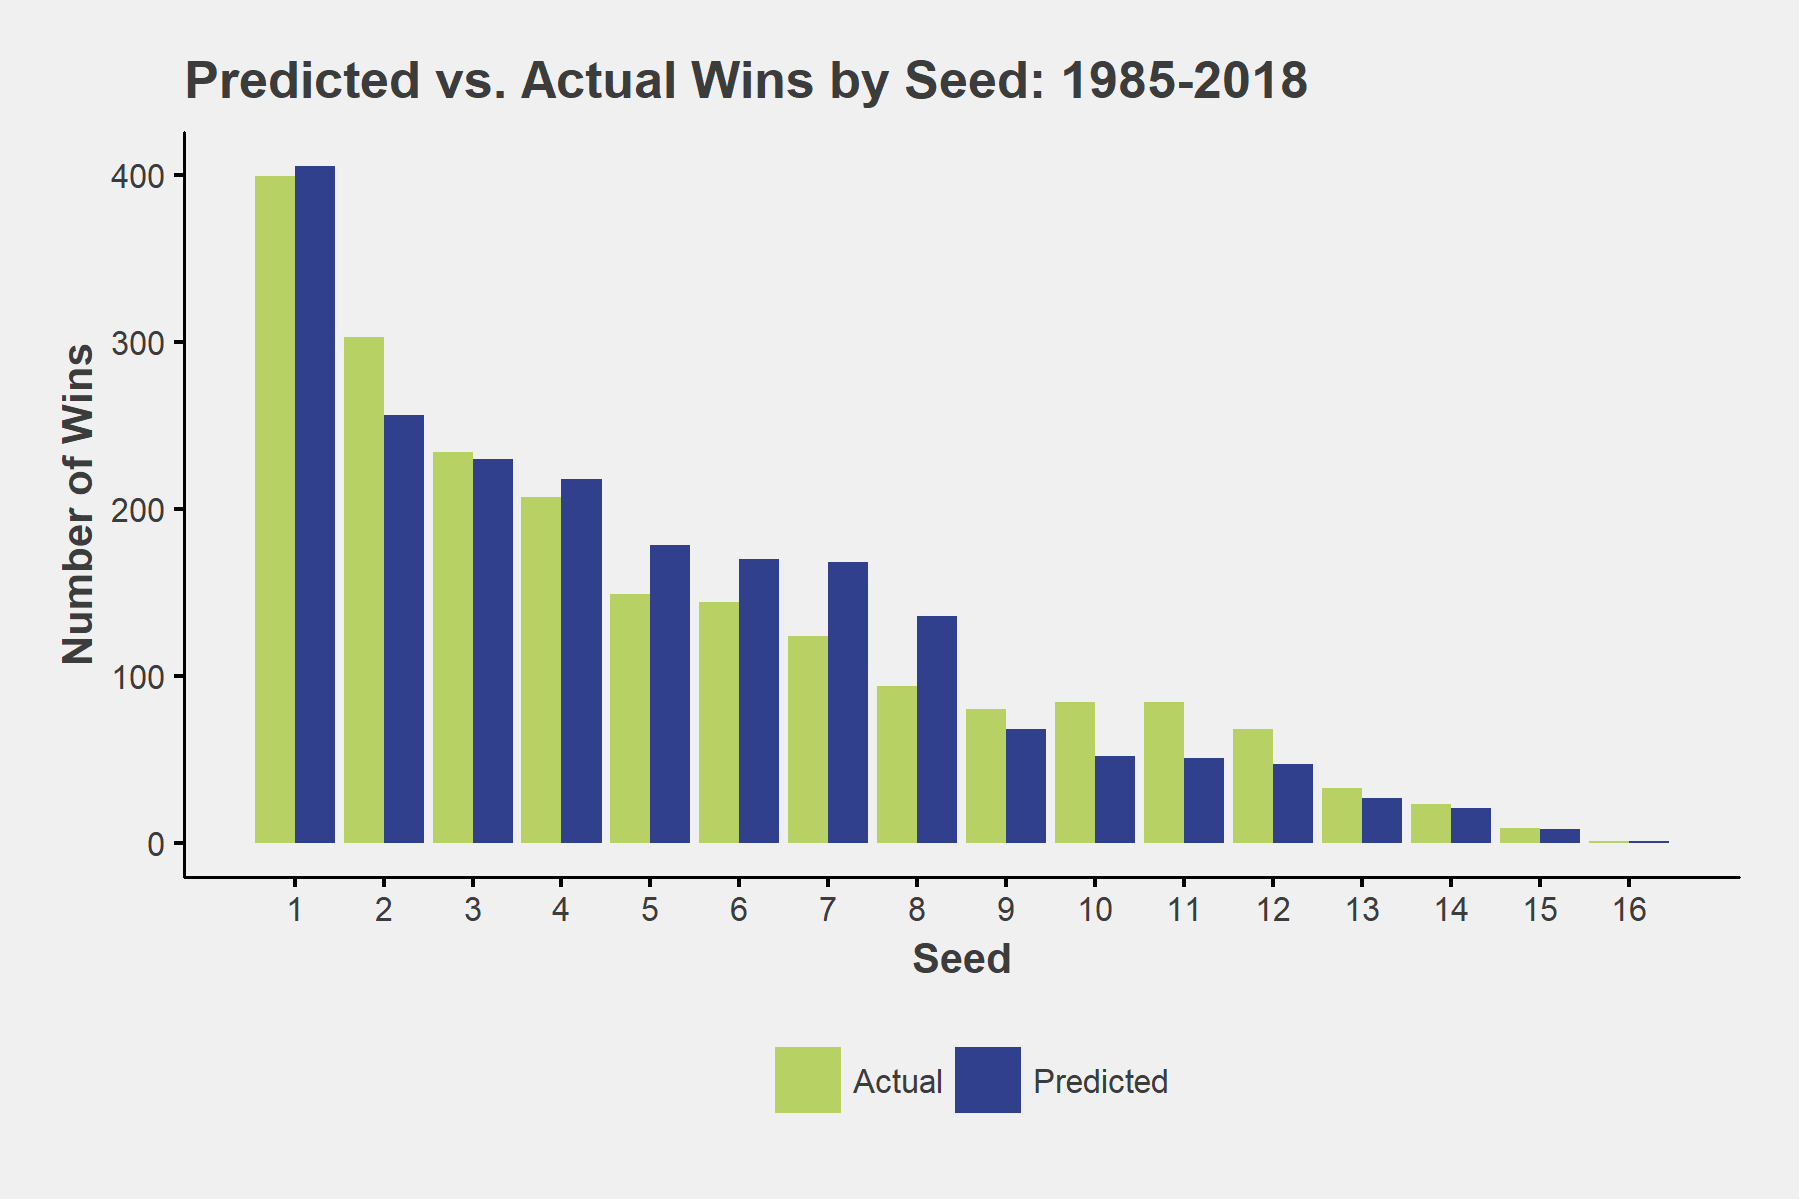
We can use negative binomial regression, a generalized linear model ideal for modeling count variables with lots of zero values, to test this outcome. Essentially, negative binomial regression models each team’s likelihood of winning any games, then models the number of games they should win.
Overall, seed ranking is remarkably predictive of the number of games a team will win — particularly for very high and very low seeds — which is another positive mark for the Selection Committee. 1-seeds should have won about 400 games since 1985² and they have slightly under-performed that mark, but not by much. The biggest sources of error are in the mid-range of 5–12 seeds, where teams are expected to be more evenly matched, and 2-seeds who generally tend to over-perform relative to expectations based on their seed.
Over time, there are no clear trends in seed performance relative to expectations. Some years 1-seeds win more games than they should and sometimes they win fewer. As a result, the year to year difference can be broadly categorized as madness.
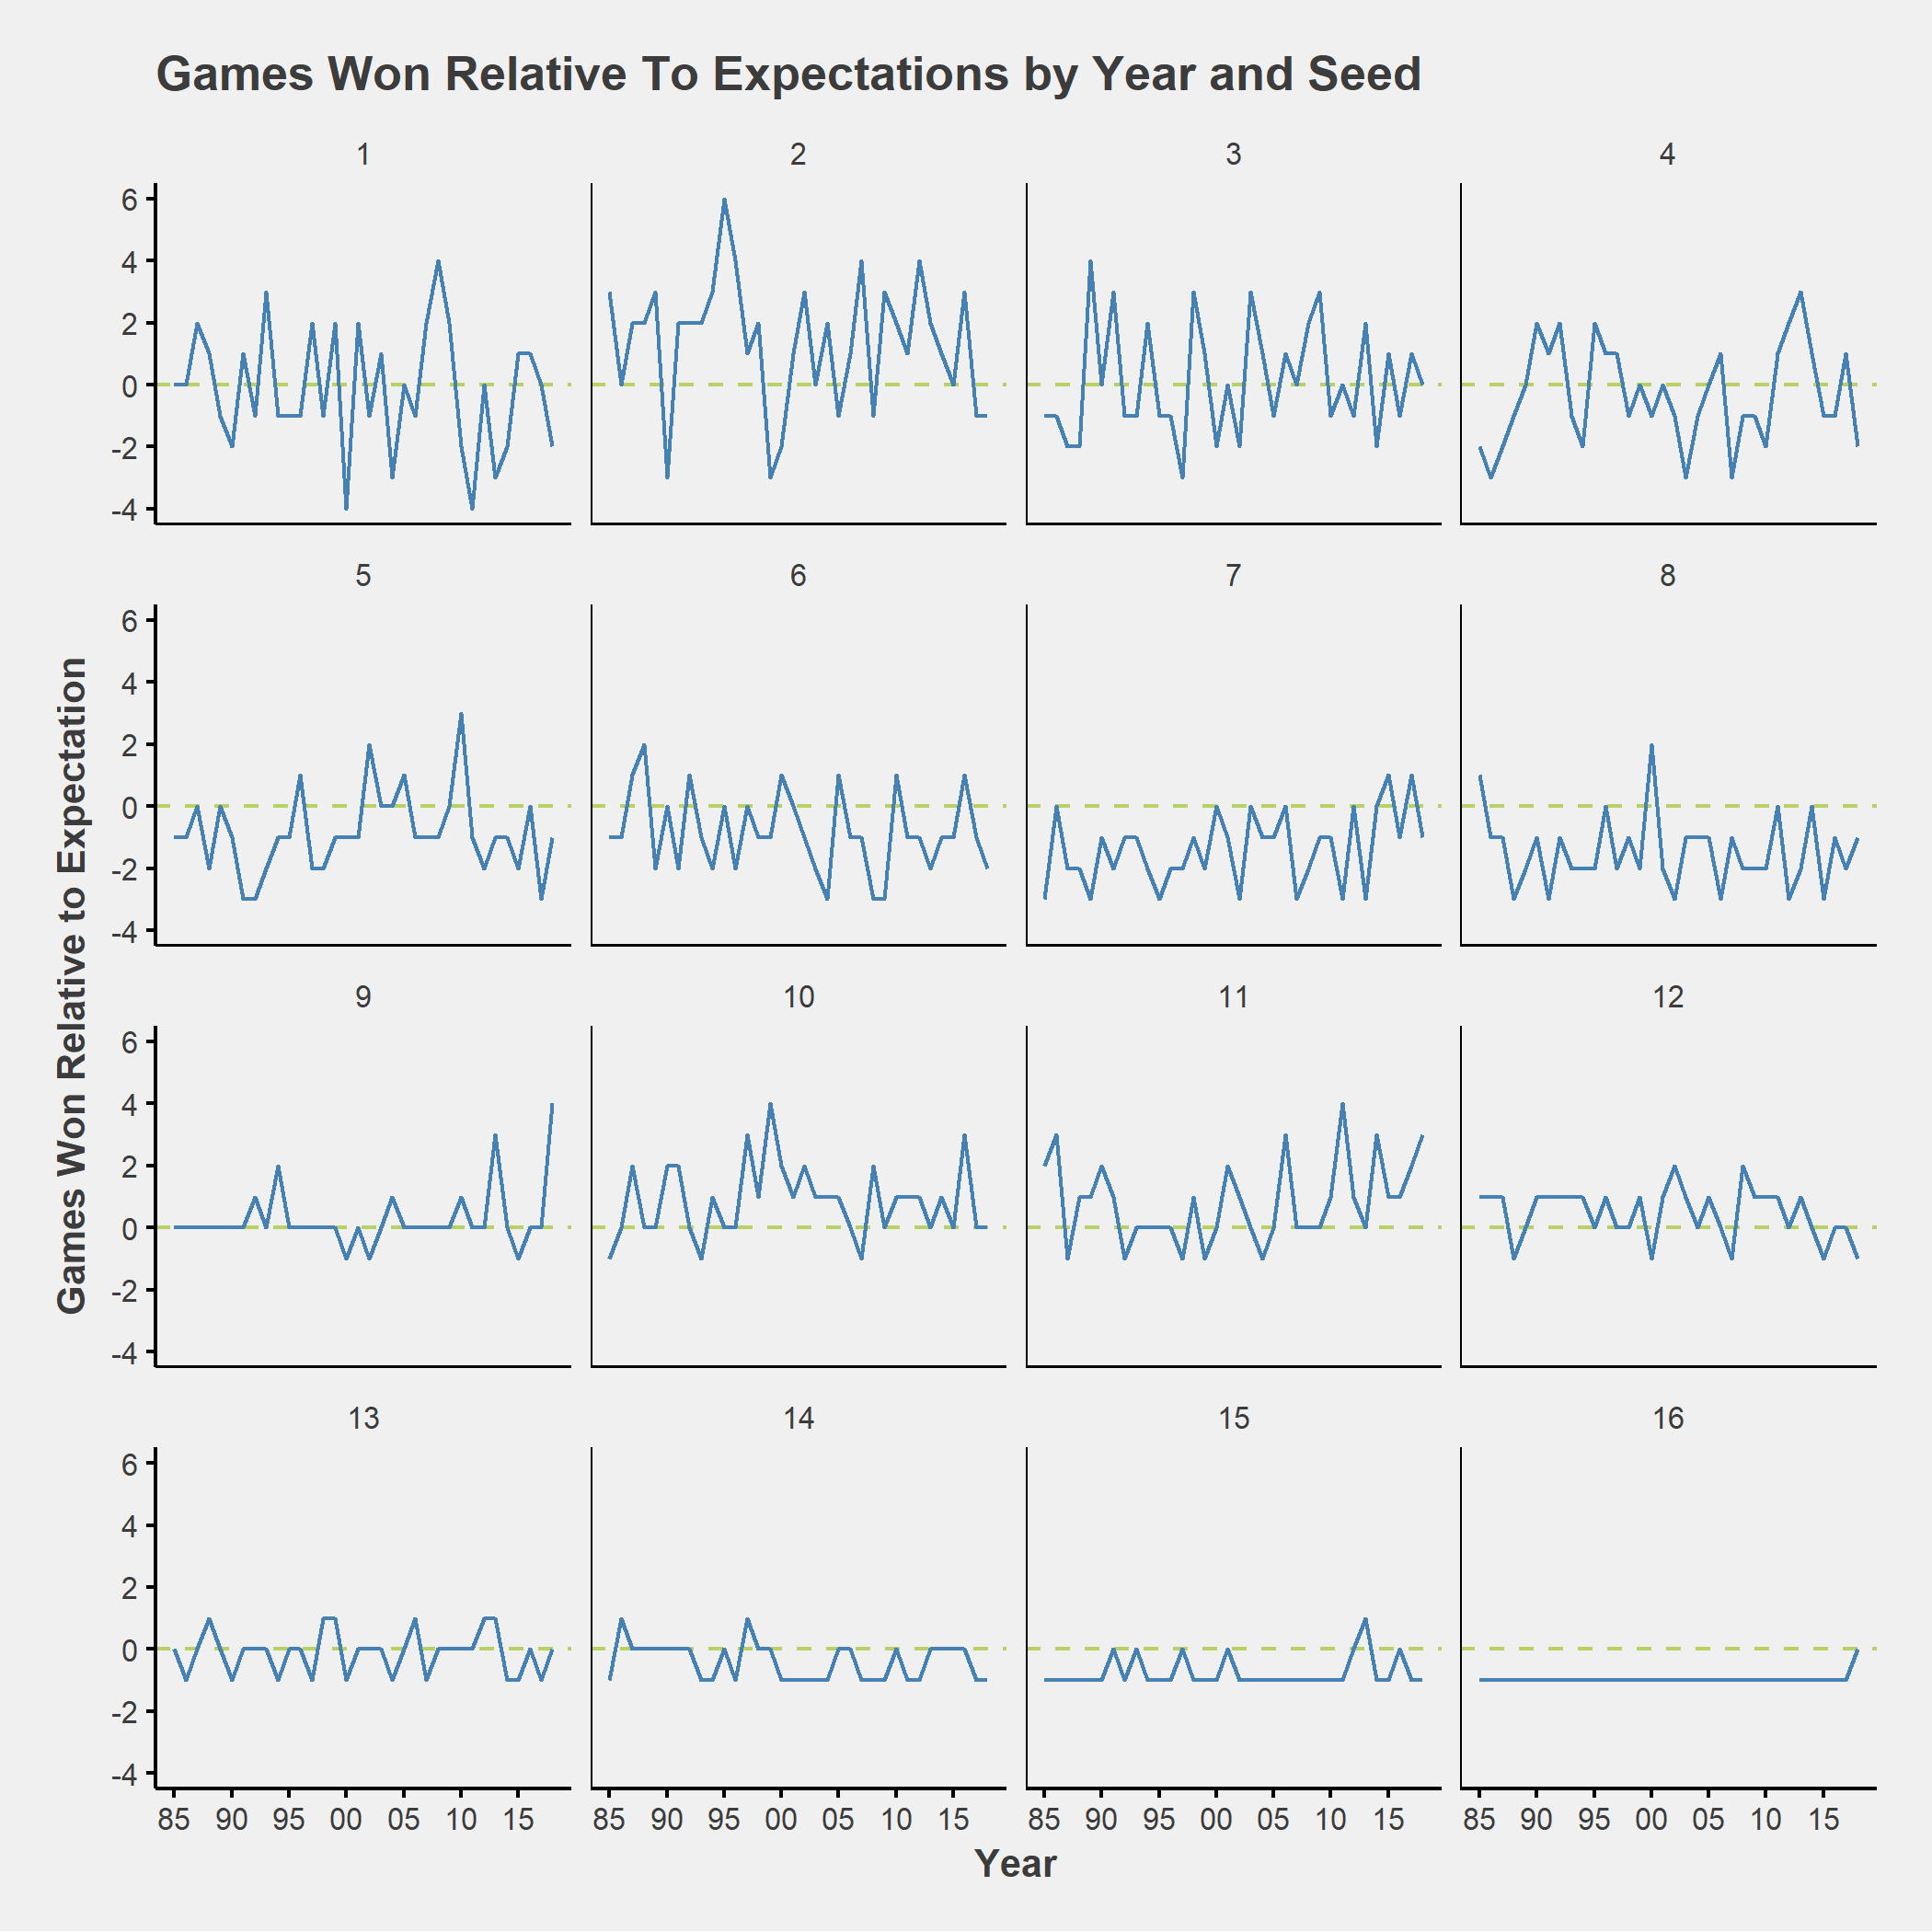
The 2018 tournament had some obvious madness around 1-seeds as UMBC(16) knocked out UVA (1) three games prior to their expected win count and Florida State (9) beat Xavier(1) two games ahead of their expected win count. Marshall (14) and Buffalo (14) upsets over Wichita State (4) and Arizona (4) respectively made 2018 a mad year for 4-seeds too.
Conclusion
While there is some debate about the quality of the selection committee’s decisions every year, there don’t tend to be as many attempts at quantitative critiques of their overall performance. Two evaluations of the Selection Committee’s performance included here offer high marks in aggregate. They generally do a good job of ranking teams as evidenced by the fact that lower seeded teams generally win more games and have advantageous match-ups. Considering the quality of the committee’s decision-making, aberrations from seed rankings offer us the ability to judge the madness of a tournament.
Footnotes
¹ Oklahoma should not have made the tourney this year, Purdue should have been a 1 seed. That is all. ² The data in this section is limited to the first four rounds because the Selection Committee’s judgement that a 1 seed is the best team in their corner of the bracket doesn’t extend to the broader bracket. Yes, there is a number 1 overall ranking, but in terms of seeds specifically, 1 is the highest ranking available.