
Text Similarity and Electability
Introduction
In early 2019 I completed the requirements for the Master’s in Predictive Analytics program at Northwestern University. One of those requirements was a thesis paper, in which I wrote about several text data analysis methods that can be applied to the question of partisan framing.
I chose to focus on text analysis because I think that when you give people a chance to speak freely most people will tend to tell you really interesting things about themselves! Language use can reveal attitudes and preferences in subtle ways that aren’t always captured by traditional survey questions. For example, asking a survey question like “Are you a racist: Yes; No” will likely not yield interesting results. Most people would answer “No” here even if they are racist. But identifying the number of times someone uses the word “lazy” to describe black people and “hard working” to describe white people can reveal racial preferences that would otherwise be hidden to the quantified world. Much of the text in our lives isn’t designed for quantitative analysis. Lincoln wrote the Gettysburg Address on an envelope - hardly machine-readable data. Text analysis tools and techniques allow us to take in and analyze all sorts of information that we put into the ether that would otherwise be lost. From an analysis of the words people use in their everyday lives, we can derive insights that tell us about who we are, how we behave, what we think is important, and more even when we’re not providing that information in a structured way.
My thesis analyzed the partisan differences in language used on the long-running Sunday morning talk show Meet the Press. I took several years’ worth of show transcripts and picked out patterns in the ways that Democrats, Republicans, and journalists discussed various topics. Across a variety of topics discussed on the show, I quantified the degree to which Democrats and Republicans used differing language to frame the way voters approached issues. Then I used those same measures to compare journalists’ language with each party and see if journalists adopt one party’s message frame over the other.
This blog post aims to summarize the most interesting metric explored in my thesis project - cosine similarity - using open-ended survey responses about what electability means to Democratic primary voters in 2020 with differing ideologies. We’ll take a bunch of disparate sentences (bag-of-words is the technical term) and pull out patterns that may not be visible on a manual reading of the question responses.
What Are We Doing In Text Analysis?
The use case for text analysis in my thesis is to study partisanship through language use. Partisanship pervades many aspects of civic life from voting in elections to where we live to whom we marry. Partisanship also often impacts how (if at all) we talk about issues. Part of the reason for this is that politicians and activists often talk about issues using specific language in hopes of framing their position in the most positive light.
A simple example of this is the tax levied against assets given to children upon the passing of their parents. Republicans call this a “death tax” because “death” sounds scary enough without being taxed for the privilege while Democrats refer to the same exact levy as an “estate tax” because only rich jerks who totally deserve to be taxed have “estates” am I right? In text analysis, we’re reformatting the text into datasets to perform quantitative analysis - to systematically search for patterns. Some of the questions we might answer sound like:
- How many times do people say “death” instead of “estate” or vice versa?
- What types of voters used the most negative language when describing Ford trucks?
- When a customer sends us a chat message that says “my account is hacked”, which customer service department to we put them in touch with? Does this sound like similar problems we’ve solved before?
These are all questions that either involve counting the number of times a pattern occurs, applying labels (like “positive” or “negative”) to individual words and then counting the labels, and identifying words that occur together frequently.
My thesis project used each of the above methods to quantify the differences in the ways parties use language to discuss issues, focusing primarily on the third type of question listed - quantifying similarities (or dissimilarities) between words used to discuss issues. I then compare partisan language to ostensibly neutral third party language from journalists. When journalists use language that is more similar to one party over the other, we can begin to infer that the party’s message frame is sinking in - people are internalizing their way of thinking and talking about an issue. Across almost every topic discussed on Meet the Press, Democrats and Republicans used demonstrably different language from one another, but on some topics, the ways journalists framed issues was more similar to one party or the other.
The goal then is to take some amount of text data and use similarity metrics to quantify how similar or dissimilar it is to another set of text data.
In the rest of this blog post I work with a set of open-ended survey responses describing the concept of electability. The data was collected by Data for Progress around the time of the first Democratic Presidential debate in 2019. I apply the cosine similarity metric to text responses from people with differing ideologies to demonstrate differences in language use.
Cosine Similarity
The Data for Progress survey includes about 2,700 responses to the following question:
Lately, there has been a lot of talk about whether candidates for office are “electable” or not. When you hear this being talked about, what type of characteristics does a candidate have to have to be “electable,” in your opinion?
Cosine similarity measures the degree to which two pieces of text are similar to one another. By comparing the similarity or dissimilarity of the ways different types of voters talk about electability, we may be able to identify key demographic and psychographic divides between voters. If we find that White and Black voters use similar language to describe an electable candidate, then race is not a large factor in the debate over electability. If we find that Men and Women use very different language, we can infer that men and women think about electability differently.
In the survey data, cosine similarity illuminates differences in the ways conservative and liberal Democratic primary voters think about which candidates are best equipped to win the general election against Donald Trump.
The Math
Cosine similarity analyzes text as vectors of word counts within a document (ie: a speech, tweet, transcript, etc). To determine the similarity of the direction of the two vectors, we multiply them together to calculate the dot product, indicating how similar the two vectors of text are. Finally, we scale the dot product to reflect the amount of text analyzed - after all it’d be hard to compare the similarity between Tolstoy and a Tweet.
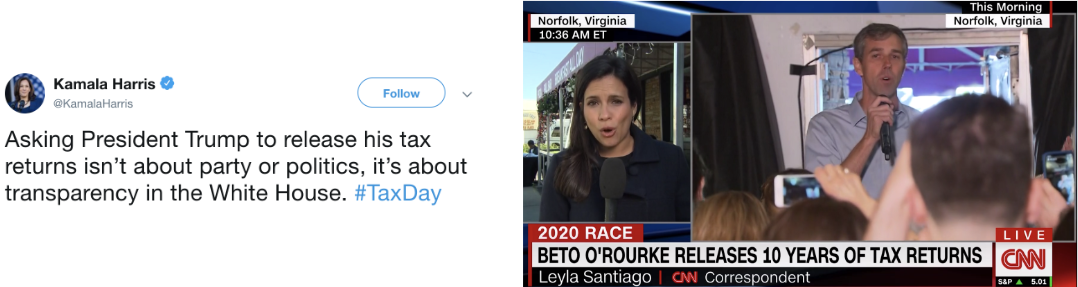
Consider the following example comparing the below Tweet from Kamala Harris with a chyron from CNN:
Step 1 of cosine similarity asks us to convert each piece of text into lists of how often each word us used.
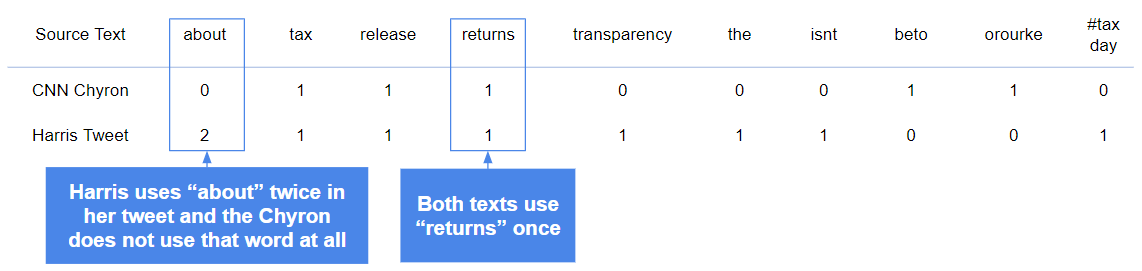
We then multiply each word count together and add up the results for each word in the vector. The word about is used twice in Harris’ tweet and zero times in CNN’s chyron so the resulting multiplication is 2 x 0 = 0. Both texts use returns once, so the math is 1 x 1 = 1. After repeating this process for all words used across each text, we add up all the multiplied word counts to get the dot product - a raw measure of how similar our two pieces of text are. In the above example the dot product is 3 because we add up the multiplied word counts for tax, release and returns and the rest of the word counts multiply to zero.
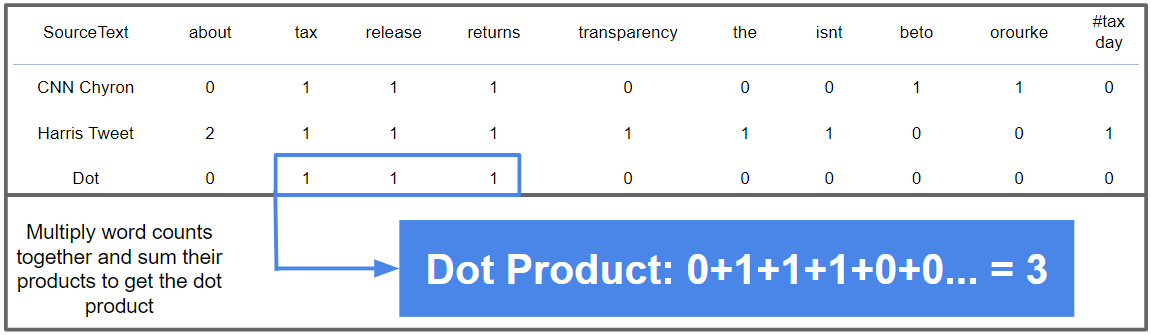
Finally, the dot product is divided by a measure of how large each text string is so that longer texts and shorter texts are more easily comparable. The cosine similarity of each piece of text above is .147 - not that similar!
Cosine Similarity and Electability
An occasional topic in every primary contest is “electability” - the perceived ability for a potential nominee to defeat the other party’s nominee in a general election. For example, maybe I agree with everything Connor Candidate stands for on the issues, but I’m convinced the rest of my district won’t vote for a man for Congress, so I’d say he’s not as electable as his female primary opponent.
Different people talk about electability in different ways - often projecting their own biases into the conversation. My example reveals my preference for a female candidate by saying I don’t think other people would vote for the male candidate regardless of the external validity of that statement.
We can observe differences in voters’ concepts of electability by measuring the similarity of the language they use to talk about electability. I tested several explanatory variables like age, race, gender, education, and urbanity but the variable that showed the biggest differences in voters’ expressions on the topic of electability is ideology. In the chart below, I plot the cosine similarity of descriptions of electability for people of differing political ideologies.
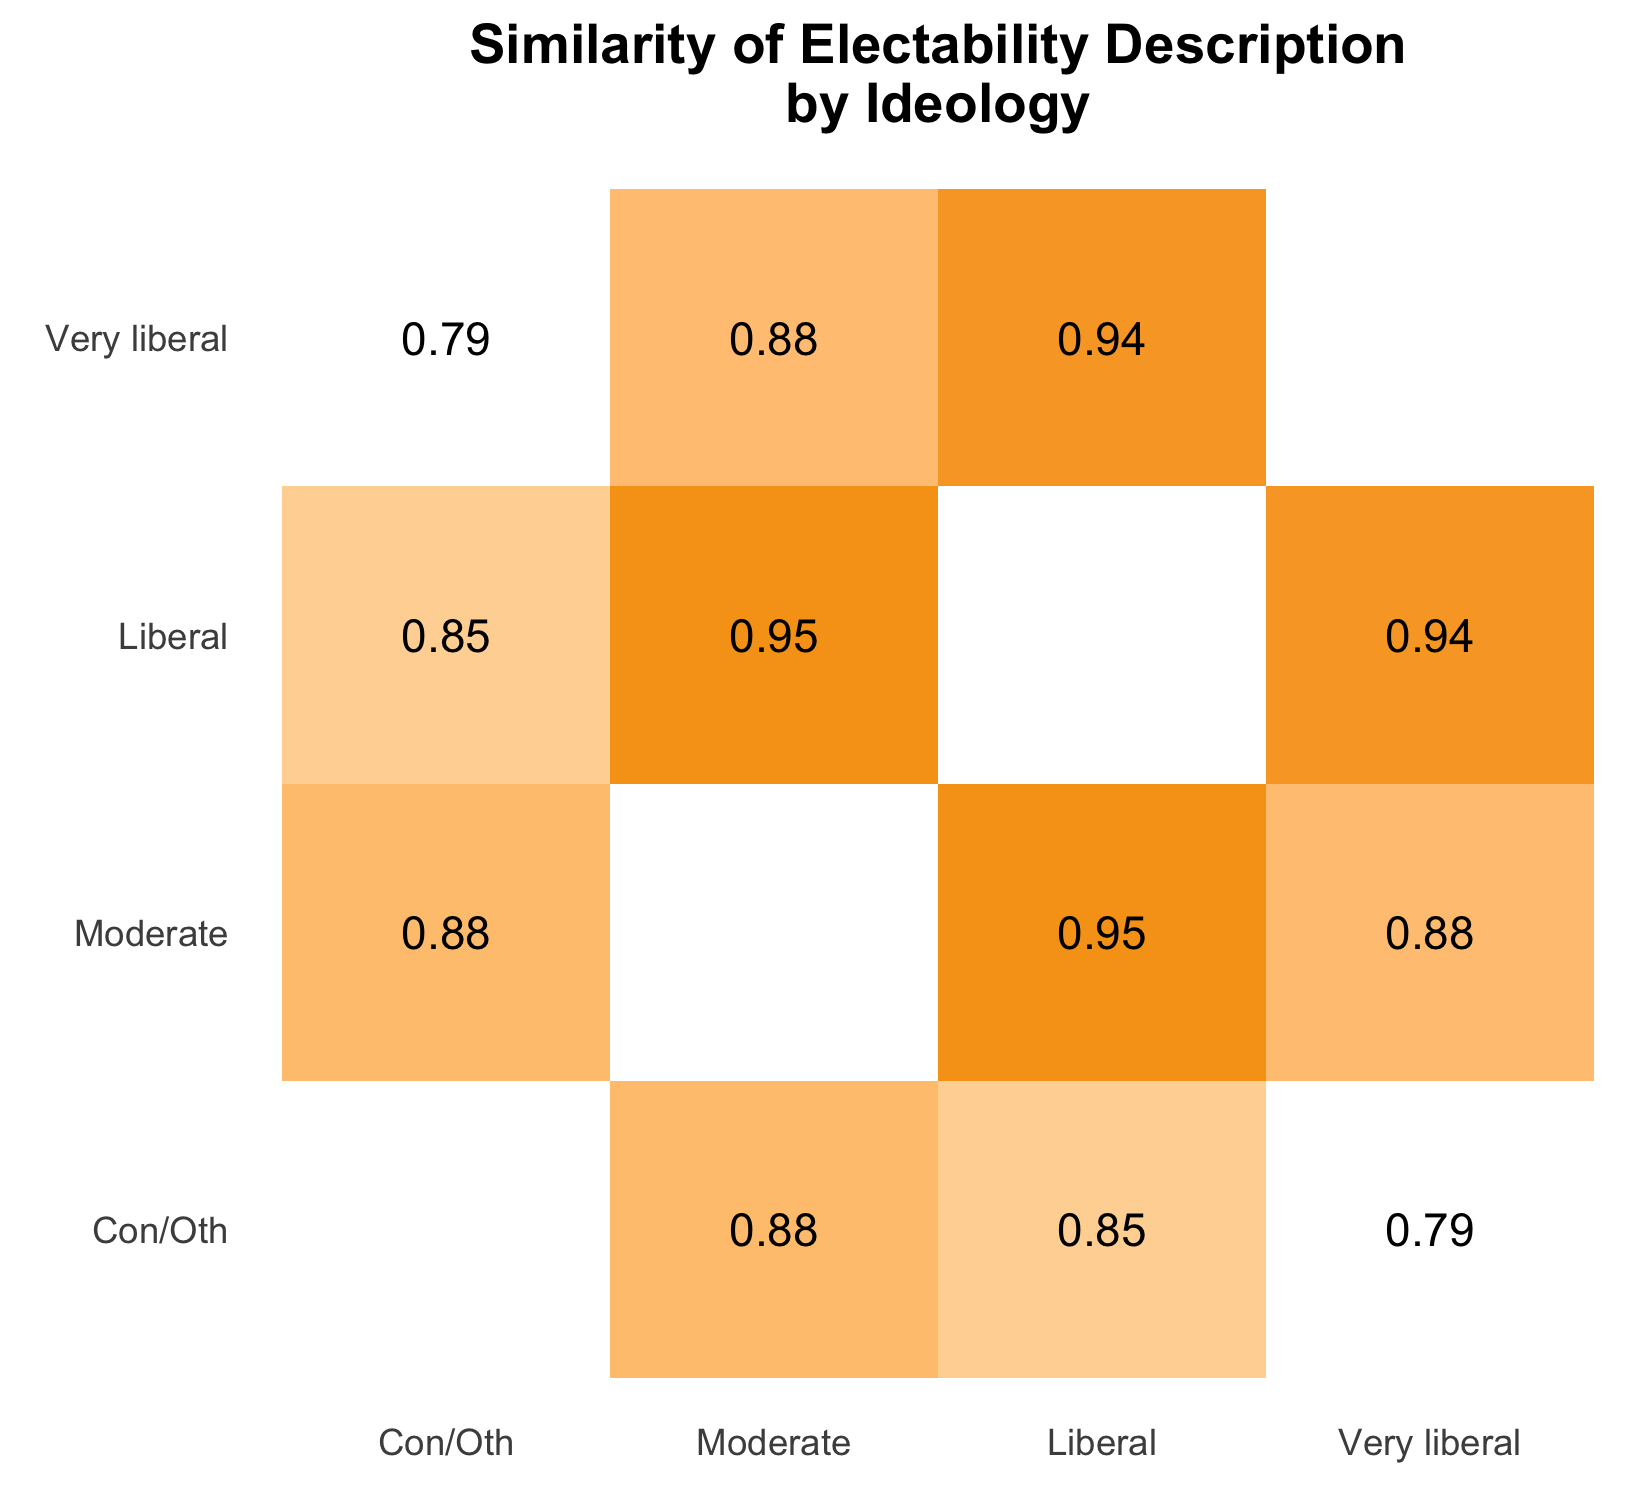
Cosine similarity demonstrates that Liberal and Very Liberal Democratic primary voters describe electability in very similar ways while Conservative and Very Liberal voters use more different language. In other words, a voter’s own, personal, ideology is important to their perception of who the rest of the country may be willing to vote for in the general election.
Conclusion
Text analysis gives researchers the ability to find structures and patterns in the natural ways we talk and write. This example analysis demonstrates the use of cosine similarity in a political research context, but there are other simpler methods too, like word counts and sentiment analysis.
Another topic not covered in this analysis is what people are actually saying when discussing electability. This method finds the fissures in our thought processes but doesn’t explain what goes on either side of the divide. Methods like word counts and topic modeling can help illuminate what people are talking about.